Data presentation for PowerPoint

  • Status: Closed
  • Prize: €120
  • Entries Received: 46
  • Winner: aimefx

Contest Brief

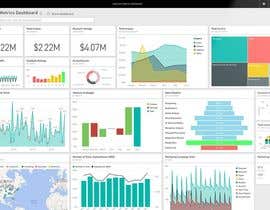
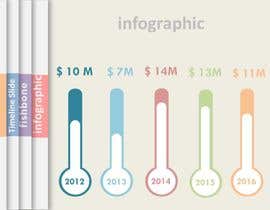
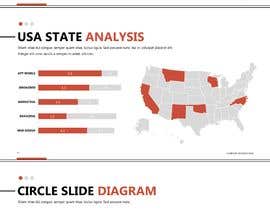
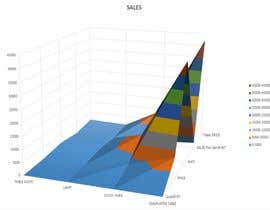
I have a series of data slides (numerical with text labelling) which would normally be represented by standard Excel bar charts/pie charts/line graphs etc etc I need to see a few options of how to graphically present them better than this in a more fresh and visually appealing manner. Ultimately I need them done in the format I select in a way that I can also edit them as needed.

Recommended Skills

Employer Feedback

“Zulifiqar was great to work with and I’d definitely recommend ”

Profile image markcorrigan, Ireland.

Public Clarification Board

  • Asianexperts
    Asianexperts
    • 5 years ago

    please check entry #46 and provide your feedback :-)

    • 5 years ago
  • juvigy
    juvigy
    • 5 years ago

    Dear Sir/Madam,
    There are millions of different ways and format the data may be represented. To choose the best or most suitable one depends on the kind of data, the audience and the purpose of the presentation. I dont see any of those in this contest so it is pointless. Please add at list a sample data.

    • 5 years ago
  • alokaryan78
    alokaryan78
    • 5 years ago

    #43 please have a look.

    • 5 years ago
  • Humza771
    Humza771
    • 5 years ago

    Dear Contestant
    I've uploaded my piece of work at #37 , this design of graphical representation suited my work the best however if your data demands another format, then that won't be an issue at all...
    Please provide your valuable feedback

    • 5 years ago
  • bkmahmood
    bkmahmood
    • 5 years ago

    Greetings, I have shared snippets of my sample work particularly with regards to data visualization/ presentation for your review. Kindly check entry #28 and provide your feedback. Cheers!

    • 5 years ago
  • dka57ea0f35a37cf
    dka57ea0f35a37cf
    • 5 years ago

    Dear Contest Holder,
    There are many talented visual designers here to help you. However please upload the existing draft so that we can work on it to achieve what you looking for.

    Regards
    Karthik

    • 5 years ago
  • arvinseeva
    arvinseeva
    • 5 years ago

    Can you share the purpose of your report, your audience and ideally the format you're looking to use to present these graphs? (ie powerpoint, prezi, etc?)

    • 5 years ago
  • wahidsoliman
    wahidsoliman
    • 5 years ago

    Please check #13 . Provide any feedback

    • 5 years ago
  • jakareyas
    jakareyas
    • 5 years ago

    Please check #11 . Provide any feedback.

    • 5 years ago

Show more comments

How to get started with contests

  • Post your contest

    Post Your Contest Quick and easy

  • Get tons of entries

    Get Tons of Entries From around the world

  • Award the best entry

    Award the best entry Download the files - Easy!

Post a Contest Now or Join us Today!