CarolinaCardoza
Venezuela

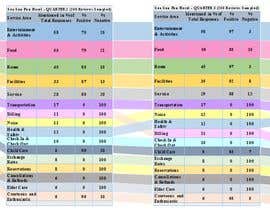
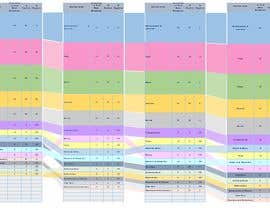
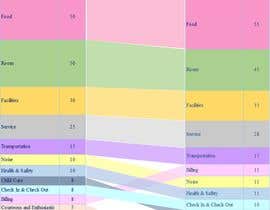
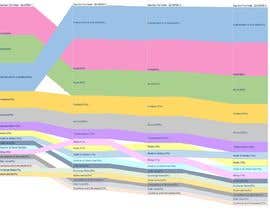
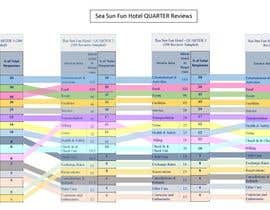
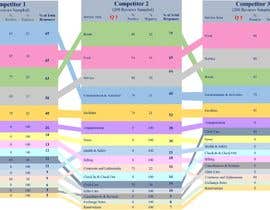
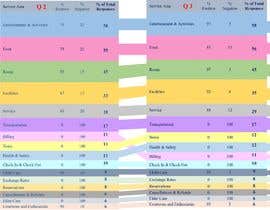
Use the Excel tables provided in sheet 1 to create diagrams in Word. The tables should be in 2 groups, one group with 4 tables that shows 4 quarterly results and the other group with 5 tables which shows the result for a company and 4 of its competitors for the same quarter.
The work involves creating arrows to link the similar items from quarter to quarter or from competitor to competitor as the case might be. As well the row height for each item should correspond to the value in the second column: % of Total Responses.
The image on sheet 2 shows what the result should look like.
All text and colors are to be taken from sheet 1, sheet 2 provides reference for how the linking arrows should look and how the row height should correspond to the column value of : % of Total Responses. Minimum row height should be 15.
“This is an excellent freelancer who did excellent work for this project. I highly recommend this freelancer.”
![]() trader12sl, Canada.
trader12sl, Canada.


Post Your Contest Quick and easy

Get Tons of Entries From around the world

Award the best entry Download the files - Easy!
